From Fluorescent Labeling and Immunochromatography to Photoelectric Quantification
Dry fluorescence immunoassay is widely used in point-of-care testing (POCT). This article outlines how immunochemical recognition, strip migration, fluorescence detection, and calibration work together to produce a result.
Keywords: POCT; fluorescence immunochromatography; dry chemistry; photoelectric quantification
01 What Is Dry Fluorescence Immunoassay?
A dry fluorescence immunoassay analyzer is a POCT instrument based on fluorescence immunochromatographic assay (FICA). “Dry” means that reagents are pre-dried and immobilized on a disposable test card or strip. Separate liquid-reagent preparation is generally not required, although the instructions may specify sample preparation or a buffer.
“Fluorescence immunoassay” describes the use of a fluorescent label to detect an antigen–antibody reaction. During testing, the specimen—such as whole blood, serum, or saliva when validated for the assay—is applied to the test card. Capillary action moves it through the strip. The target binds to a fluorescently labeled antibody, and the complex is captured at the test line (T line) by an immobilized capture antibody.
After the card is inserted, the analyzer measures fluorescence at the T line and control line (C line). Some systems use a T/C signal ratio with assay-specific calibration to calculate analyte concentration; the calculation method varies by product.
Typical test menus may include viral antigens, hormones, drugs of abuse, C-reactive protein (CRP), procalcitonin (PCT), glycated hemoglobin, and alpha-fetoprotein (AFP). Applications depend on the validated assay and intended setting, including emergency, primary-care, and home-testing environments.
02 Basic Principle Fluorescent Labeling and Immunochromatography
2.1 Immunochromatography and the Sandwich Assay
A typical strip consists of four overlapping components: a sample pad, a conjugate pad, a nitrocellulose (NC) membrane, and an absorbent pad. The conjugate pad contains dried fluorescently labeled antibody. The T line on the NC membrane is coated with a capture antibody; the C line is coated with a secondary antibody that captures the labeled antibody according to the assay design.
Figure 1 shows the migration and capture sequence. In a sandwich assay, the target binds the labeled detection antibody and is then captured at the T line, forming a capture antibody–target–labeled antibody complex.
[IMAGE 1 POSITION — strip architecture and sandwich-assay workflow]
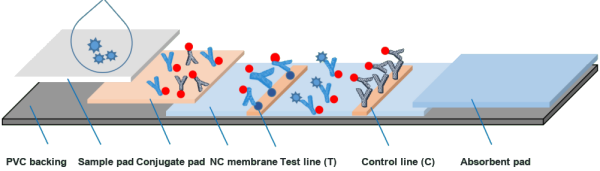
Figure 1. Dry fluorescence immunochromatographic assay in a sandwich format: sample application, chromatographic migration and complex formation, followed by analyzer measurement of T- and C-line fluorescence.
Sandwich assays are suitable for many larger analytes, such as proteins and viral antigens. For small molecules or haptens that cannot bind two antibodies simultaneously, a competitive format may be used. In a common design, the T line is coated with an analyte analogue. More analyte in the sample results in less labeled antibody being captured at the T line, so the T-line signal decreases. This is the opposite signal direction from a sandwich assay.
2.2 Why Fluorescence Stokes Shift and Signal-to-Noise Ratio
When a fluorescent label absorbs excitation light, it emits light at a longer wavelength. The difference between the excitation and emission wavelengths is called the Stokes shift. A suitable spectral separation and emission filter help distinguish fluorescence from excitation light and background, improving the signal-to-noise ratio.
Compared with visual colorimetric methods such as colloidal-gold assays, fluorescence detection can provide greater analytical sensitivity when the label, assay chemistry, optics, and signal processing are appropriately optimized. The improvement is system-dependent and should not be assumed to be a fixed number of orders of magnitude.
[IMAGE 2 POSITION — illustration of delayed fluorescence and Stokes shift]
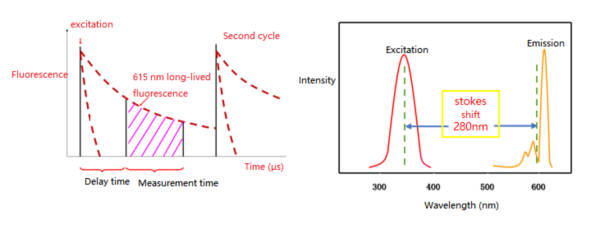
Figure 2. Illustration of time-resolved fluorescence measurement and the spectral separation between excitation and emission.
03 Fluorescent Label Systems
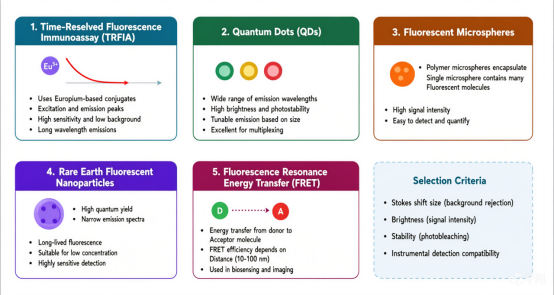
Assay performance depends in part on the fluorescent label. Common label classes include organic fluorescent dyes, quantum dots, and upconversion nanoparticles. These labels differ in excitation and emission properties, stability, and background characteristics; selection must be compatible with the reagent chemistry and analyzer optics.
[IMAGE 3 POSITION — original label-classification visual in the source document]
[The source document contains a visual/object at this position, but its image data was not recoverable. Insert the corresponding original visual here before publication.]
04 Instrument Detection Principles Light, Electronics, and Signal Chain
4.1 Optical System and V-Shaped Non-Confocal Geometry
The optical system is typically enclosed in a light-shielded compartment and includes a light source, excitation and collection paths, a photodetector, and amplification electronics. One compact design uses a V-shaped optical arrangement: two matching LEDs illuminate the strip from opposing angles, while fluorescence is collected along a separate, approximately perpendicular path through a filter, lens, and aperture to the detector. Exact geometry varies by analyzer.
[IMAGE 4 POSITION — example V-shaped optical path in the analyzer]
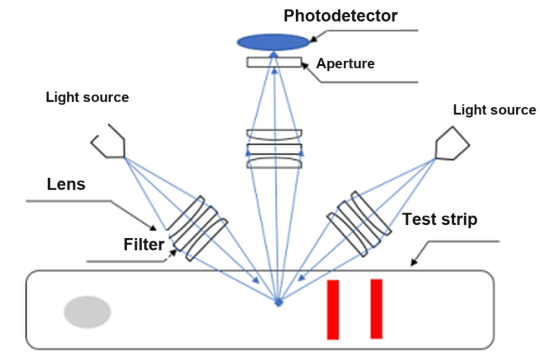
Figure 4. Example V-shaped optical arrangement for exciting and collecting fluorescence from a test strip.
A confocal arrangement shares a focal point between the excitation and collection paths. Depending on the design, it can improve spatial discrimination and signal-to-background performance, but it is generally more complex and costly. Detector selection is also application-specific: avalanche photodiodes (APDs) provide compact size and internal gain; photomultiplier tubes (PMTs) can provide very high sensitivity but require high-voltage circuitry; silicon photodiodes (SiPIN) offer fast response and low cost for suitable signal levels.
4.2 Signal Processing From Photons to Concentration
Fluorescence signals are weak and require a measurement chain that typically includes photoelectric conversion, low-noise amplification, filtering, analog-to-digital conversion, and digital processing. The analyzer may scan the strip step by step, synchronizing sampling with the motion mechanism to acquire T- and C-line signals.
[IMAGE 5 POSITION — signal-processing chain from LED excitation to concentration output]
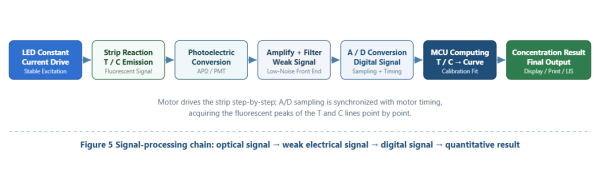
Figure 5. Signal-processing chain: optical signal → weak electrical signal → digital signal → quantitative result.
Where the assay uses a T/C calculation, the reported concentration can be represented as:
C_sample = f(I_T / I_C)
where I_T and I_C are the measured fluorescence intensities at the test and control lines. The exact calculation is assay- and instrument-specific; not every system uses this ratio.
05 Quantification and Calibration Curve
Fluorescence intensity is not inherently linear with analyte concentration, so quantitative assays require a validated calibration model. During calibration, materials with known concentrations are measured to establish the relationship between signal and concentration. Depending on the assay, the data may be fitted with a linear model, a four-parameter logistic (4PL) model, or another validated function.
The source describes an example using at least eight concentration levels for an analyte such as CRP, with calibration parameters stored on an IC card supplied with the reagent kit. The number of levels, curve model, and data-storage method are product-specific and are not universal requirements. During testing, the analyzer reads the applicable lot parameters, measures the sample signal, and calculates a result within the validated measuring range.
For any inquiries, please feel free to contact us!